We got a request from researcher and writer, Igor Zhirkov to make infographics for Low-Level-Programming-Assembly-Execution-Architecture book. The book supposed to be about Intel 64 assembly language, architecture and should be full of diagrams.
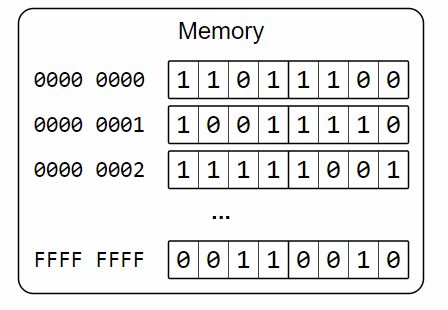
Graphics should be printed, so the preferred format is a vector. Resulting pictures consist of many parts and these parts should be configurable and reusable. For example, we would show a block:
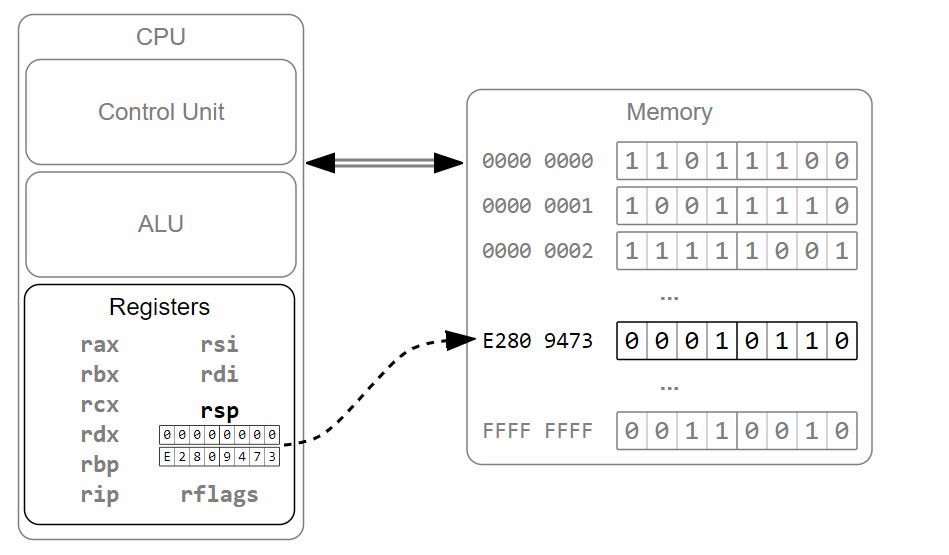
... as a component of a bigger scheme:
We can use SVG and a vector graphics output format. We know that there are some components we would see in different contexts. Let's use Vue.js for the best appearance and easier manipulation of our result graphic.
We are going to write code which generates code for a book about programming :)
Like what we do? Check out services.

