Grafana is a popular, open-source tool for beautifully visualising time-series data. TimescaleDB is an open-source time-series database that natively supports full SQL, while scaling to 100s of billions of rows. It is packaged as a Postgres extension and optimized for fast ingest and complex time-series analytics; it is operationally familiar yet built for time-series use cases. In many time-series use cases, you may have multiple metrics that you want to plot against each other. In this case, the Grafana plugin called plotly-panel is quite helpful and we demonstrate this below.
For context, CorpGlory Inc. is a data analysis / visualisation agency focused on time-series related projects and Grafana consulting. One of our products is Hastic.io, a tool for Grafana for pattern / anomaly detection.
We got a request from the Alternative Resource Energy Authority to monitor their 10-turbine, 23.5 MW Ellershouse Wind Farm ,that provides renewable energy to 4 municipal electric utilities in Nova Scotia, Canada.
In this post we describe how we do time-series analysis with TimescaleDB and how it saved our life because of full SQL support and its features.
Let's install natel-plotly-panel first. It can be done easily using the grafana-cli as described in the documentation: https://grafana.com/plugins/natel-plotly-panel/installation
After following those steps, we need to fill our database. Follow the link to get all the necessary info and a test-dataset: github.com/CorpGlory/winds-power-extras/how-to.
And configure the TimescaleDB datasource then:
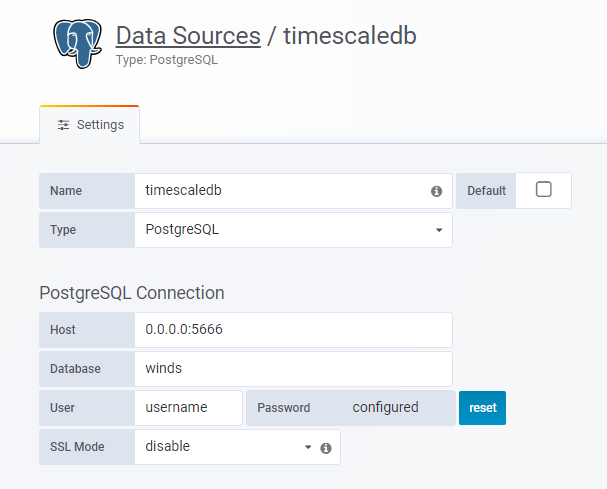
TimescaleDB has a first class integration with Grafana and because it is a Postgres extension it leverages the PostgreSQL datasource as its own. The developers at Timescale have also contributed in a big way to the PostgreSQL datasource, adding a graphical query builder, which makes working with more complex SQL queries and building insightful dashboards much easier.
To connect TimescaleDB and Grafana all you need is to choose the “PostgreSQL” datasource type, fill in the host, database, and password fields, and you’re ready to go.
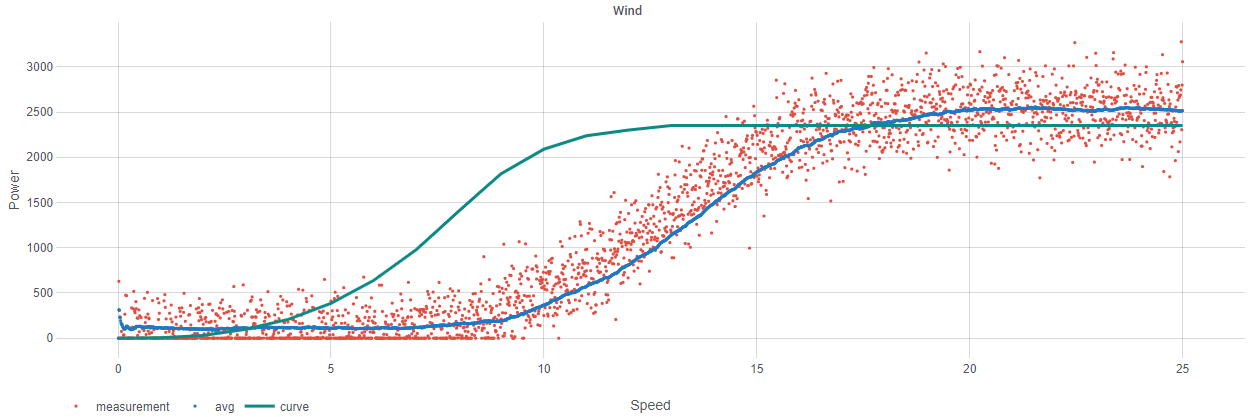
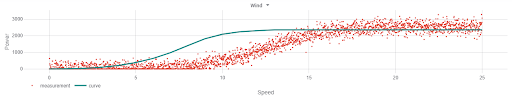
In our case we are collecting metrics from a working turbine. Our dataset contains wind power and wind speed metrics for each timestamp. We understand what the optimal curve of speed / power dependency should be. What we want is to see how actual values differ from optimal ones. This is what we want to get:
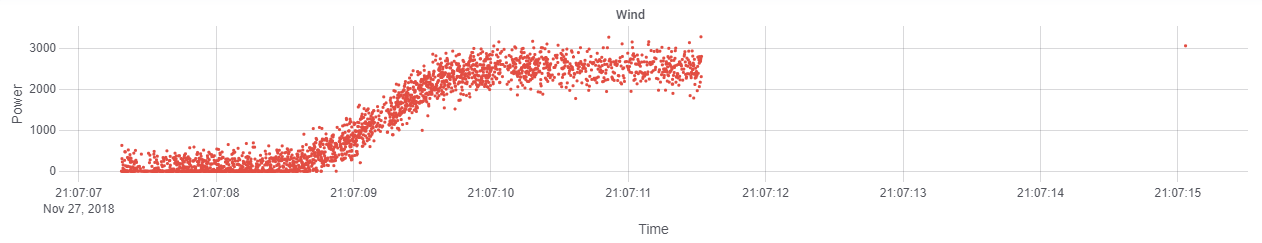
First we'll render one metric. To do this in TimescaleDB, all we need to do is to write a simple SQL query:
SELECT
  $__time(time), power
FROM
  wind_pwr_spd
WHERE
  $__timeFilter(time)
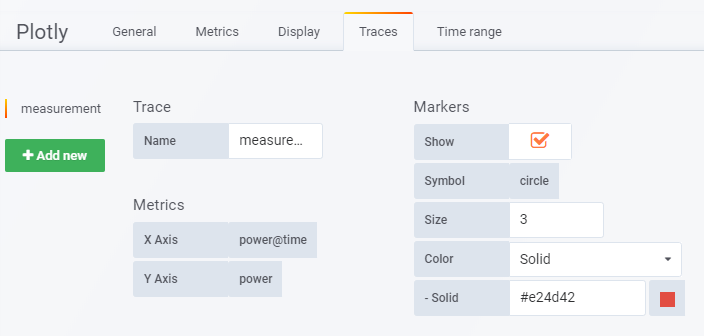
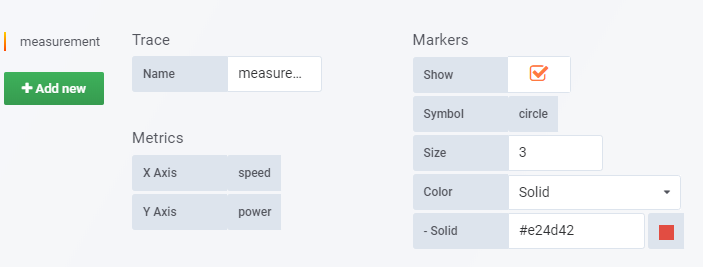
Then we’ll configure “trace”, in order to get a plot of power of time:
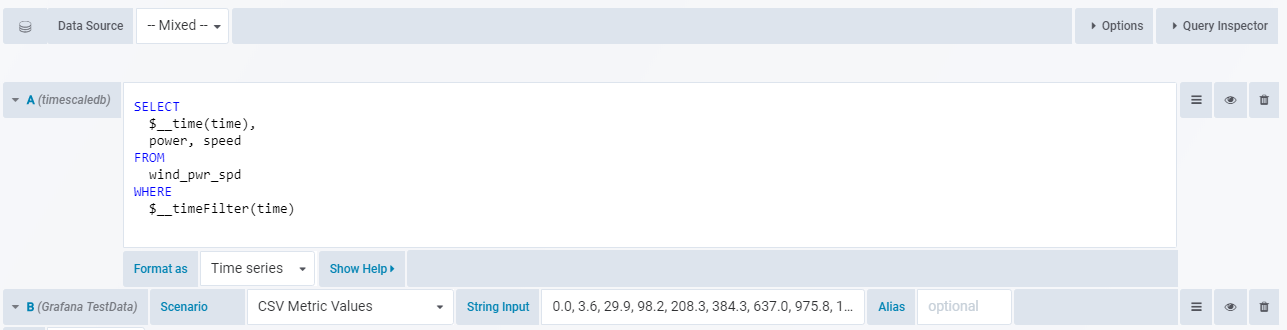
Now we'll plot power over speed. To do that we should slightly change our SQL-query:
SELECT
  $__time(time), speed, power
FROM
  wind_pwr_spd
WHERE
  $__timeFilter(time)
And update “Metrics” in our “trace” field:
This is what we get:
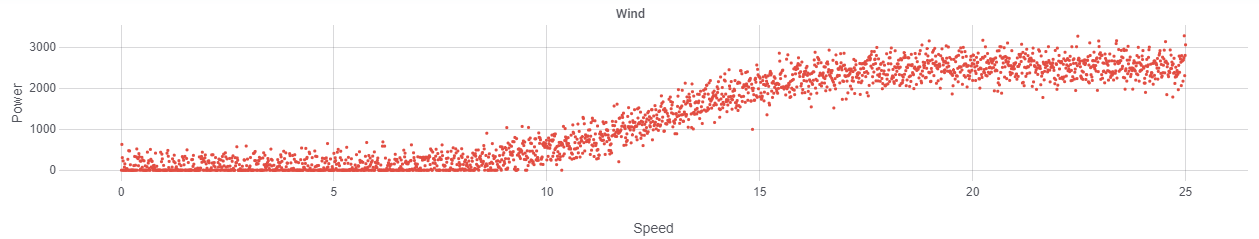
Remember, what we want is to see how actual values differ from optimal values
To visualize this we can add another “trace” to plot the static optimal curve of speed / power dependency. We should set datasource to “--Mixed--” so that we can use different data sources in different metrics. Then we use “Grafana TestData” to import a static CSV which will represent our “guarantee curve”.
We can click “Add new” on the left side of “Traces” tab to add a new “trace”. The ability to add multiple traces is a relatively new natel-plotly-panel feature, implemented by the CorpGlory Dev Team. Here is the related GitHub issue (since Closed), for anyone interested in reading more about some of the use cases for plotting multiple time-series.
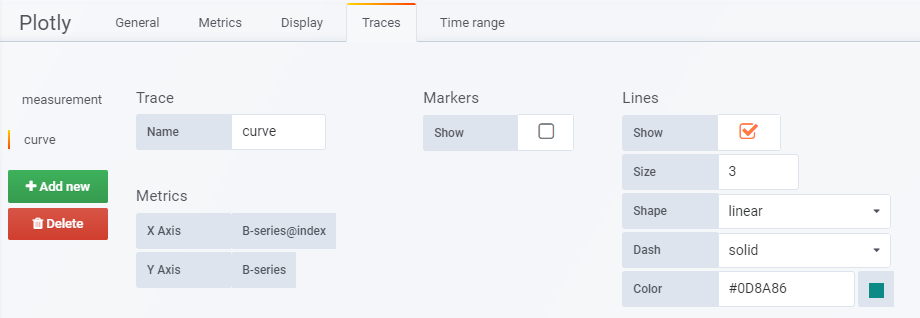
After adding our new trace and importing the static curve, this is what we get:
While we can still perform the actions above with other time-series databases, what if the aggregations we want or need to make are difficult, not performant, or impossible with other solutions? This is where SQL comes in. SQL is obviously a mature query and programming language and many people, including the team at CorpGlory Dev team, make heavy use of it.
For our use case, we did realise that we could really benefit from full SQL support to aggregate by some non-time field, such as wind speed in our case. TimescaleDB natively supports full SQL and so all we need to do is utilize its power and count the average value in a window with a size of 150 rows. Here is our query:
SELECT
  $__time(time),
  speed as avg_speed,
  AVG(power) OVER(ORDER BY speed ROWS BETWEEN 70 PRECEDING AND 70 FOLLOWING)
FROM
  wind_pwr_spd
WHERE
  $__timeFilter(time)
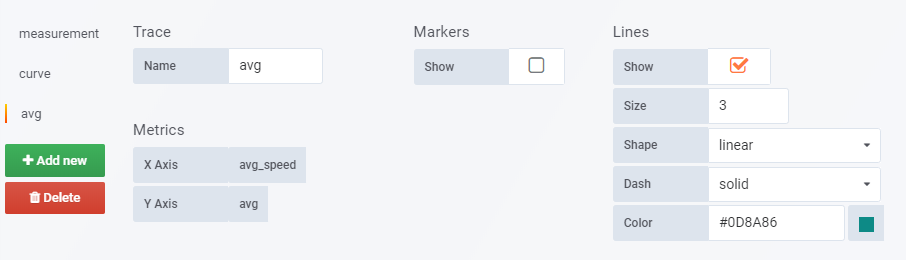
We then add another “trace” with “speed” field as our X-axis and the average power value as the Y-axis:
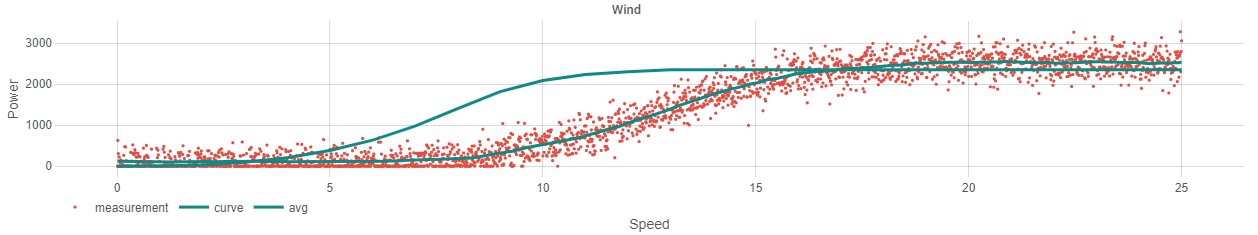
The result is a graph that plots our wind speed and wind power metrics together, along with our pre-defined optimal values curve in relation to the actual values curve. Here we go:<
We found that Grafana can be used as a powerful time-series analysis tool in production. Grafana offers a growing set of custom panels that can be used to boost your Grafana visualisations and we find plotly-panel to be one of the best (which is why we helped to make it better! Finally, full SQL support is really a life-saver for time-series analysis and thanks to TimescaleDB, we can leverage full SQL, at scale, for working with both our time-series and relational metadata.
Thanks for reading! To learn more, take a look at some next steps :)
TimescaleDB and Grafana hosted a webinar called Visualizing Time-Series Data with TimescaleDB and Grafana which you can watch here.
We encourage you to watch the recording to see these technologies in action. In fact, I first found out about TimescaleDB through a webinar. At the time, we were struggling with InfluxDB and after watching Timescale’s webinar we realized that there was a solution for our problems.
So make sure you check it out!
Like what we do? Check out services.

